We paired off to work on small areas of our project. Me and James have started to work on visual ideas for the statistics to be included in the booklet. These facts are:
"Leeds has the third highest burglary rates in the whole of the UK."
"20% of all student robberies happen in the first 6 weeks."
"One in three students are victims of crime."
We are wanting to use very simple diagrams, like graphs and pie charts. For the first stat we thought we'd just use text and use red to embolden some important words to make them jump off the page.
We've created a bar graph and line graph for the second statistic, we are unsure which to use.
For the third stat, we will use a pie chart as it works well with it being a third. It's really simple and easy to understand.
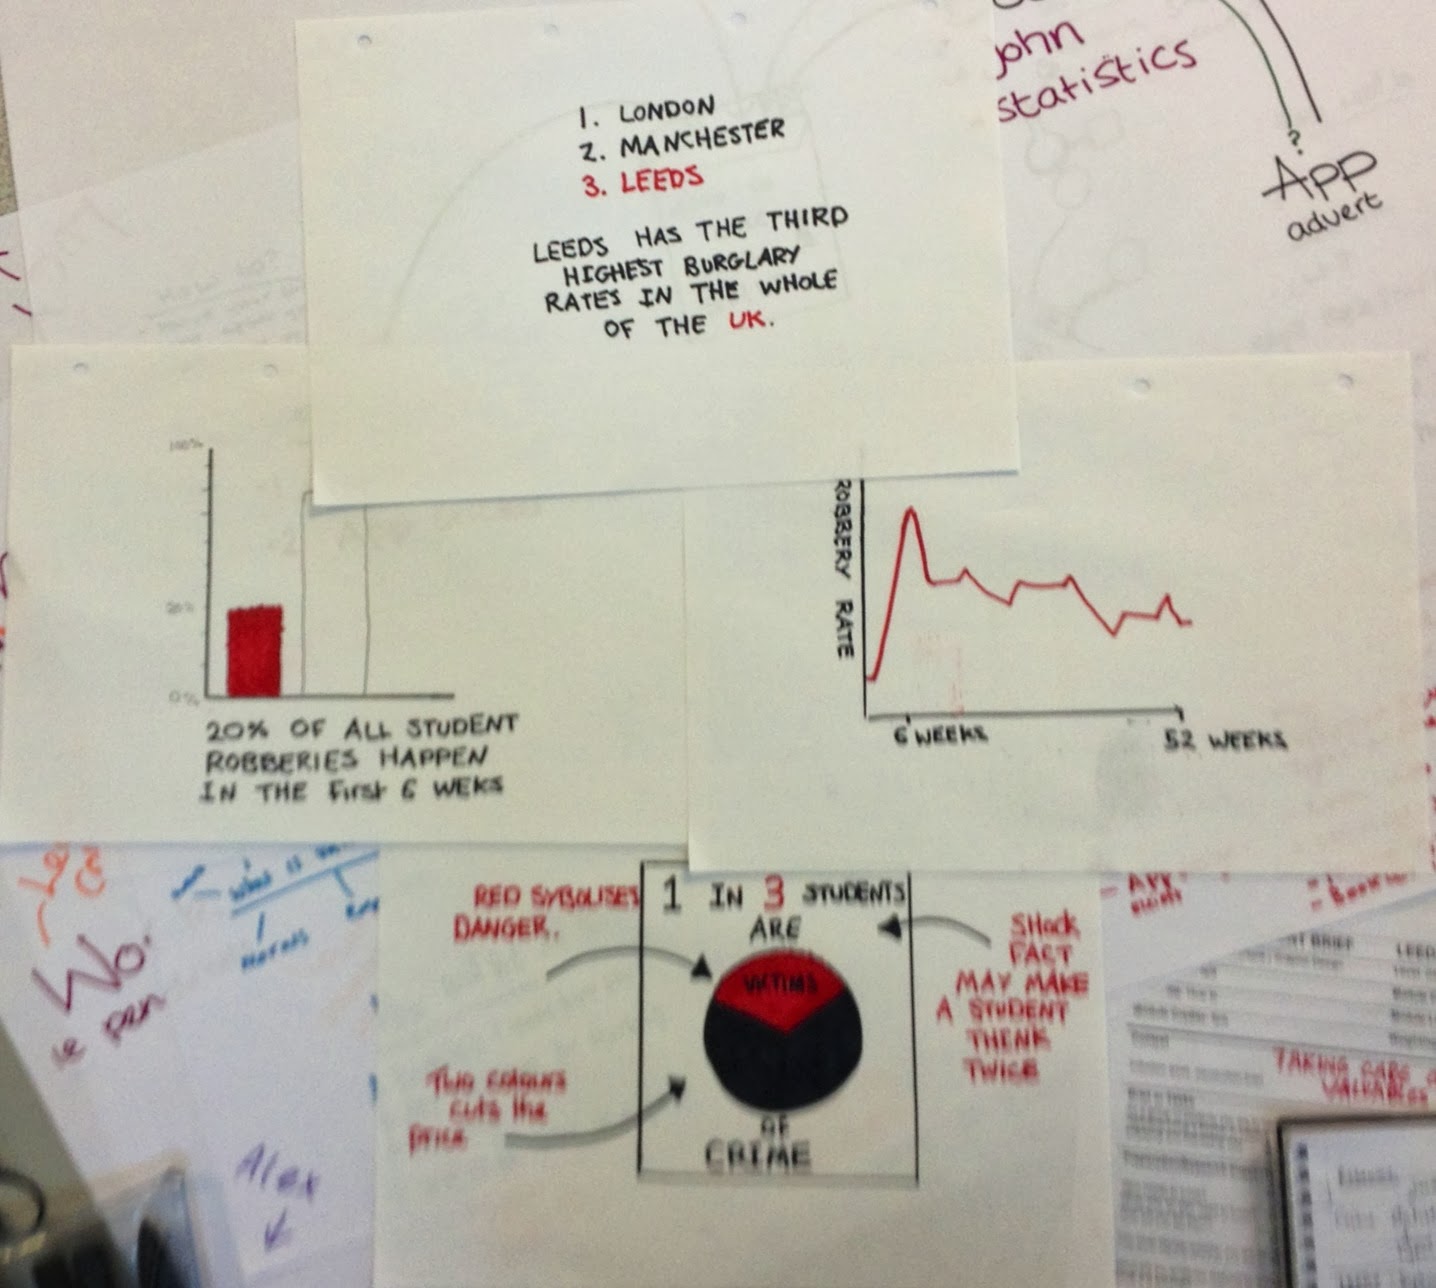
We want to use red, white and black to signify danger and to keep it extremely minimal and simple, also straight to the point. The capital letters throughout make it seem urgent and important.
 |
| Planning of the booklet and where the stats will be put |
No comments:
Post a Comment